|
|
|


|
Main
Page by Topic |
||
|
C.
Statistics |
||
Introduction
to VaR ‘Value-at-Risk’
Overview
This page
provides readers with a high level introduction to Value-at-Risk, known as
‘VaR’.
It also
contains the best description and comparison of the three methodologies as used
by the industry that you’ll ever read.
They go by the names of ‘parametric’, ‘historic’ and ‘Monte Carlo’.
For additional
details on Historic VaR, click here:
Outline
1) What Is VaR?
3) Comparison to a Stress Test Report
4) Comparison of VaR Methodologies
5) Considerations for CTRM System Design
VaR, i.e.,
Value at Risk, is a measure of how much money you might lose ‘worst case’ based
on your current positions (i.e., market risk for existing trades).
The time frame
is defined as one day, i.e., VaR shows how much you might lose between today
and tomorrow.
The typical
definition of ‘worst case’ is 95%. So
far shows the threshold of what you might lose, financially, due to adverse
market moves, 5% of the time.
Example: If your VaR is $1000, you would be expected
to lose more than $1000 5% of the time.
VaR does not say how much you might lose, e.g., with a VaR of $1000, you
might one day lose $2000 or even $5000 and that would be entirely consistent
with the way VaR is defined and used.
Note that 5%
is one in twenty. There are typically
around 22 business days in a month. So
your VaR number could also be thought of as the amount of month you lose on
your worst day in any given month. And
that can be important for firms in terms of how much risk capital they need to
have on hand.
2.1) Just a
single number
An important
thing to consider about VaR is that it is just a single number, i.e., a single
numeric value, no matter how many trades/positions you have. While this is one of VaR’s
strengths, its simplicity, it is also one of its limitations.
Clearly you
can’t expect to get too much information by summarizing ‘everything’ into just
one number. So as a practical matter,
risk managers should supplement VaR with stress test reports that show PnL
(profit/loss) from defined market moves like up 5%, down 5%, etc.
Clarifying a
bit: You can see VaR by some criteria, e.g. ,VaR by Trader is common. Point here is that is still just one number
and so won’t be as good on its own as looking at both VaR and a Stress Test
report.
2.2) The assumptions are not valid.
There. I said it.
The assumptions of a typical VaR formula are demonstrably wrong.
Example: Some VaR models assume prices changes are
lognormally distributed. Note that we
are talking about ‘prices changes’ and not ‘prices’. E.g., if the price of a commodity goes from
$30 to $31, it is the $1 that we are talking about as the price change.
Though
technically, models will use the percentage of the price change, which is 3.333%
for the above example.
Getting even
more technical, models will assume the log (‘ln’ in Excel, the natural log) of
the price change. Ln(31/30)
in this case = 3.279%
In any case….
Prices can jump, e.g., double or get cut in half in one day in a much greater
frequency in the real world than what a lognormal distribution would predict.
3) Comparison
to a Stress Test Report
I like to say
that, “VaR is like a Stress Test Report if you add probability”.
Suppose you
have a Stress Test Report that shows PnL or Risk for shocks to the market from
-10% to up 10% in increments of 1%, like this:
-10%, -9%,
-8%, …, -3%, -2%, -1%, 0%, +1%, +2%, …, +10%
And suppose
you just has one position, e.g., long 100 Crude Oil contracts. One position means you don’t need to worry
about correlations.
You might
determine that there is only a 5% chance that prices will drop by more than
3%. In other words, a 95% chance that
prices will change by -3% or less, i.e., meaning could go anywhere from down 3%
to up any amount.
In that case,
you can look at your PnL at the -3% mark in your stress test report and that
would be your VaR, though take the absolute value. E.g., if at -3% on your Stress Test, you lost
$100k, then we would stay your VaR is $100k.
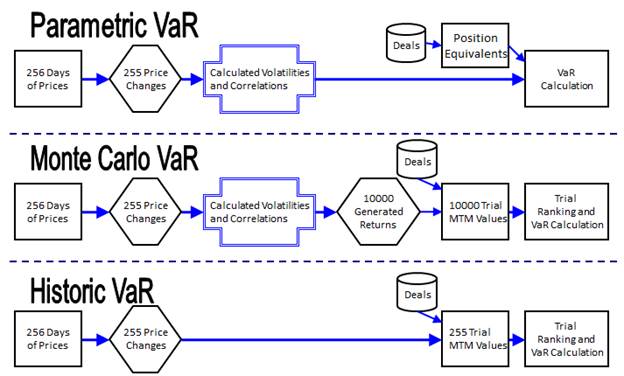
4) Comparison of
VaR Methodologies
VaR
methodologies, as shown in the below diagram, are:
4.1)
Parametric VaR
This is a
‘closed form’ formula that takes certain inputs, including trade ‘deltas’
(market risk positions) and volatilities and correlations and produces a VaR number.
The
volatilities and correlations are calculated based on actual (historic) prices
and their corresponding price changes (day over day). This is usually done as a separate step,
i.e., prior to running VaR.
4.2) Historic
VaR
Historic VaR
uses just the set of prices and price changes you start with, i.e., unlike
Monte Carlo VaR, which generates the new set of price changes.
I.e., is
doesn’t require the extra steps of creating volatilities and correlations and
it runs far fewer MTM trials.
Historic VaR
is arguably the simplest way to calculate VaR.
4.3) Monte
Carlo VaR
This starts
with the same historic prices, i.e., like parametric VaR, and calculates the
same volatilities and correlations, but then, instead of plugging them into a
formula to get your VaR value, it will take those volatilities and correlations
and generate 10,000 ‘fake’ price changes.
It will take
those fake price changes, which, by the way, have the attributing of having the
same volatility and correlations as your original set of prices (if you were to
work that out) and use them to calculate the value of your trades (the ‘MTM’ –
mark to market) by taking the current day’s prices and ‘shocking’ them up/down
by the price changes.
This has the
effect of smoothing things a bit relative to just using the limited set of
prices and price changes that you started with.
Then, as a
final step, you need to order/sort/rank the 10,000 trials by MTM value, from
best to worst. Then take the 500th
worst value, which is 5% * 10,000. That is
your VaR number. Though the ‘worst’
value would be negative, e.g., -$30,000, meaning you would lose $30,000 if
prices move like that 500th worst trial values, you would indicate
VaR using the absolute value, i.e., +$30,000, and it would be understood that
it is an amount you could lose (not gain).
5) Considerations
for CTRM System Design
5.1) CTRM
systems should support all of the above VaR methodologies. And, specifically, they should support them
*at the same time*. i.e., there should
not be a single global setting that indicates the VaR methodology.
i.e., firms
will want to run more than one VaR methodology and have it be super easy.
For example,
running Monte Carlo VaR is notoriously slow, because of the large, e.g., 10,000
‘trials’ (calculating MTM for each set of price changes), and it won’t
necessarily give you a materially different number than using historic
VaR. So maybe a firm might want to run
historic VaR every day and then maybe Monte Carlo VaR periodically, e.g., once
a month, so as to confirm that the ending VaR values are pretty much the same.
5.2) In the diagram, you see 256 Days of prices. This is meant to be for a year, since there are
approximately 256 good business days in a year (subtract weekends and
holidays). However, each firm may want
a different value of days to use.
I personally
prefer 41 days of prices, so 40 days of price changes. This is a nice value, because using a 95%
threshold confidence level, you get an integer number, e.g., 5% * 40 = 2. So you can take the second to worst trial day
to be your VaR number. If you were to
use 50 days and want 5%, you would have to interpolate between the 2nd
and 3rd worst days to get VaR values.
CTRM systems
should allow for users to specify the number of days to go back. i.e., specifically mean the number of trial
days / business days. i.e., not just say
‘2 months’, which might be 44 days at one point and 43 days for another day of
the year, depending on how many days are in the months and holidays. CTRM systems should support both an explicit
number of days to use as well as based on a calendar range, e.g., ‘6 months’.
And CTRM
system should support running VaR with two different sets of days *at the same
time*. e.g., might want to run VaR with
both 40 days of price changes (most recent 40 days) as well as with 120 days of
price changes.
Why? May want to compare the
two. Most of the time, you’ll get
approximately the same VaR number (using 5% threshold). It would tell you something if you get a much
different number, e.g., if the prior 40 days were particularly more volatility
that then months that preceded them.
5.3) The 95%
confidence threshold is also something that should not only be user
configurable, you should be able to run two VaR calcs
using two different thresholds, e.g., 95% and 99% *at the same time*. i.e.., therefore, this can’t be a global
system setting.
5.4) Same for Monte Carlo VaR trials. E.g., should be able to run 500, 1000, 2000,
5000, and 10,000 trial Monte Carlo VaR *at the same time* if desired.
5.5) Show your
work!
In math class,
a teacher may give you only partial credit if you just put the correct
answer. You need to show your work, the intermediate
steps, to get full credit. Same with VaR in CTRM systems.
It can be
super confusing to try to figure out why a VaR number changed from one day to
another. Was it due to different
trades/positions? Was it due to price
changes, i.e., this day’s set of historic price days versus shifted one back
from the prior day?
The solution
is not complete until you can provide tools/reports showing the risk managers
every detail about every intermediate step in the process.
5.6) You should also give them ‘hooks’ at each step in the
process, so they can change/modify things.
For example, for Monte Carlo VaR, after the system generates the 10,000
‘trial’ price changes… users should be able to access that set of data and
modify those prices. Maybe to introduce
some extra ‘shocks’ or put in some additional logic or checking.
5.7) Should also be able to read in those shock values from a
file or another system, e.g., to calculate them offline.
5.8) Though we mentioned above VaR is just one number for all
trades, you should also give firms the ability to calculate/produce additional
VaR values by *any* criteria, e.g., one VaR value per commodity. Or even down to one VaR value per trade. This can be useful in troubleshooting issues
and/or understanding, from a risk management point of view, how to interpret
the overall VaR number.
5.9) Backtesting
System should
give users the ability to easily ‘backtest’ the VaR
number. E.g., if you run a 95% VaR, you
expect to lose more than the VaR number 5% of the time, or about 1 day a
month. If you are losing more than the
VaR number, say, 5 days a month, then that might indicate an issue. Need to be easily able to backtest
to detect that.
Note that the
VaR numbers only work on the trades ‘as is’, i.e., so don’t include PnL effects
of new trades done the next day, amendments or cancelations. Some use the terms ‘clean’ or ‘dirty’ PnL to
clarify the difference. i.e., for VaR backtesting, you would need to use ‘clean’ PnL, i.e.,
assume that the only thing that happens the next day is that prices change
(assume no trading/scheduling, etc.).
Introduction to
CTRM
Click on this
link for a great introduction to CTRM software: Introduction to CTRM Software