Intro
to Probability and Statistics
Sample
Midterm #1 – Questions And Answers (Answer Key)
Professor Brian Shydlo
Instructions:
1) Please
write your name: _____________________________________
2) There
are 7 questions totaling 100 points. Please be careful to answer all questions.
Partial credit will be given (so show your work).
Question 1)
15 Points
Question 2)
20 Points
Question 3)
10 Points
Question 4)
15 Points
Question 5)
15 Points
Question 6)
5 Points
Question 7)
12 Points
Question 8)
8 Points
Total
100 Points
Question
1) (15 points in total) Basic Statistics
You have
the following set of numbers.
10, 15, 16,
8, 17, 18, 20, 31, 4, 5, 10
Question
1a) (3 points) What
is the Mean?
The answer is (4 + 5 + 8 + 10 + 10 + 15 + 16 + 17 + 18 + 20 + 31) /
11
= 14
Question
1b) (3 points) What
is the Median?
The answer is the middle number, in this case the 6th number out of
11, which is 15.
There
was a hint of difficultly, since the numbers were not listed in order. Some may have picked the middle number,
which is 17. You have to order the
numbers first.
Question
1c) (3 points) What
is the Mode?
The mode is the most frequent number, which in this case is 10.
|
A |
B |
|
|
|
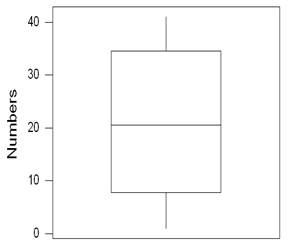
Question
1d) (3 points)
Observe the Boxplots above (they are each based on a different set of number,
not shown). The interquartile range of
BoxPlot A is 9 to 35. What is the
significance of the interquartile Range?
50% of the data is between 9 and 35 (in this case). 25% of the data is above 35 and 25% is below
9.
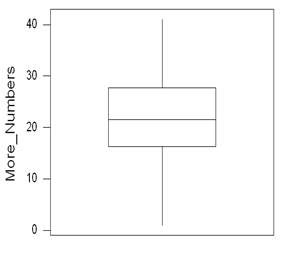
Question
1e) (3 points)
Observe the Boxplots above. Which plot
appears to have a lower variance.
BoxPlot B. The interquartile
range is tinier. (FYI… in the actual
dataset I used, the data behind BoxPlot A had a Variance of 190.44 and the data
behind BoxPlot B had a variance of 128.14)
Question
2) (22 points in total) Basic Probability
The following
is a chart of a probability distribution.
It shows a Random Variable called x and the probability function for x
(known as f(x)). For example, there is a
5% chance that x would equal 0.
|
x |
f(x) |
|
0 |
5% |
|
2 |
10% |
|
3 |
20% |
|
5 |
Purposely left blank |
|
9 |
35% |
Question
2a) (2 points) What
is the probability that x = 5?
You know the total probability has to add up to 100%.
5% + 10% + 20% + ??? + 35% = 100%
The answer is 30%
Question
2b) (2 points) Fill
in the chart to produce the Cumulative Probability Function (known as
F(x)).
|
x |
F(x) |
|
0 |
5% |
|
2 |
15% |
|
3 |
35% |
|
5 |
65% |
|
9 |
100% |
Question
2c) (5 points) An article in this week's Business Week says
that if there is a War in Iraq, there are exactly three possible ways a war in
Iraq can affect Oil prices. They are
listed below along with the estimated probability of each.
|
Scenario # |
Scenario Description |
Probability Estimates (from Brian,
not from BW) |
|
1 |
Quick
conflict, oil fields undamaged, leads to a "Moderate Decline" in
Oil prices as they go to $20/ barrel range |
70% |
|
2 |
Stiff
resistance, oil fields somewhat damaged, leads to a "stubborn high"
prices as they stay in the $30s for a year. |
25% |
|
3 |
Iraq
destroys various oil facilities in and about Iraq, leading to "Dangerous
Spike" of $80 to $100 |
5% |
Furthermore,
I read that if there is no war, it is expected (100% chance) that Oil prices
will exhibit a Moderate Decline to the $20/barrel range (an identical scenario
to Scenario 1 above)
Brian
estimates the following probabilities for whether or not there will be a war:
|
Scenario # |
Scenario Description |
Probability
Estimates (from Brian, not from BW) |
|
1 |
War |
89.5% |
|
2 |
No War |
10.5% |
Define Two
Events, A and B such that:
A = Prices
go Down the $20/barrel range. (Meaning
that the Moderate Decline described in scenario A Happens)
B = There
is a War.
Question: What are the odds that there is a War and
that Prices go down to the $20/barrel range.
(In other words, both A and B happen)
Hint:
Think Intersection
We
are looking for this: P( A ∩ B)
Use
this formula: P( A | B) = P( A ∩ B) / P(B)
Rearrange
to this: P( A | B) * P(B) = P( A ∩ B)
P(A
| B) = 70% This was given in the first table.
P(B)
= 89.5% This was given in the
Second Table.
So
P( A | B) * P(B) = P( A ∩ B) = 0.70% * 89.5% = 59.5%
P( A ∩ B) = 62.65%
Question
2d) (5 points) Based on the same data and assumptions as in
the previous question, what is the probability of A occurring (remember A =
Prices go Down the $20/barrel range and can occur if there is or is not a war).
A' = Ā = A Complement (I realized I got
the symbol for an A with a bar over it, but I still needed B with a Bar over
it.)
|
|
A |
A' |
|
|
B |
62.65%1 |
26.85%3 |
89.5%2 |
|
B' |
10.5%4 |
0% |
10.5%2 |
|
|
73.15%5 |
26.85%5 |
100.00% |
1)
This is ( A ∩
B)
and was found in the previous question.
2)
Given.
3)
26.85% = 89.5% - 62.65%
4)
If B' happens (meaning there is no war), then prices will go down the
$20/barrel range (meaning A will happen)
More
formally:
P(
A | B') = P( A ∩
B') /
P(B')
P(
A | B') = 100% (given)
P(B')
= 10.5% (given)
rearrange
to get this:
P(
A | B') * P(B') = P( A ∩ B')
100%
* 10.5% = 10.5%
5)
Solve for this by adding up the values in the column:
62.65%
+ 10.5% = 73.15%
26.85%
+ 0% = 26.85%
Answer = 73.15% (read off
probability box)
Question
2e) (3 points) Are
A and B statistically Independent based on the data in the above problems, and
if so, why (in other words, show a proof, don't just put a yes or a no for full
credit.)?
Recall
that:
A = Prices
go Down the $20/barrel range.
B = There
is a War.
Remember,
if independent, then P( A ∩ B) = P(A) * P(B)
P(
A ∩ B) was solved to be
62.65%
P(B)
= 89.5%
P(A)
was solved to be 73.15%
62.65% is not equal to 73.15 * 89.5% (which is 65.469250%), so A
and B are not Independent.
Question
2f) (3 points)
Assume A
and B are Mutually Exclusive.
Give one
example where A' and B' are mutually exclusive and one example where A' and B'
are not mutually exclusive.
Example
1 where A' and B' are Mutually Exclusive
If
A = Flip a coin and get a Head
B = Flip a coin (same coin) and get a Tail
Then
A' = flip a coin and get a Tail.
B' = flip a coin and get a Head.
Example
2 where A' and B' are NOT Mutually Exclusive
A
= roll a die and get a 2
B
= roll a die and get a 3
A'
= Roll a 1,3,4,5,6
B'
= Roll a 1,2,4,5,6
A'
and B' are NOT Mutually Exclusive (e.g., you could roll a 1, 4, 5, or 6 and A'
will be true and B' will be true)
Question 3) (10
points) You have
the following distribution for stock market price returns:
|
Market Return |
Probability |
|
20% |
60% |
|
2% |
30% |
|
-5% |
10% |
Question
3a) (5 points) What
is the Expected Value of your return?
20% * 60%
+ 2% * 30%
+ -5% * 10%
_______________
= 12.1%
Question
3b) (5 points) What
is the Standard Deviation of Your Return?
|
Probability |
Return |
Expected Value |
Return - Expected Value |
(Return - Expected Value)2 |
(Return - Expected Value) x Probability |
|
20% |
60% |
12.10% |
7.90% |
0.6241% |
0.374% |
|
2% |
30% |
12.10% |
-10.10% |
1.0201% |
0.306% |
|
-5% |
10% |
12.10% |
-17.10% |
2.9241% |
0.292% |
|
|
|
|
|
|
|
|
|
|
|
|
Sum = |
0.9729% |
The
Variance is 0.9729%
The Standard Deviation is the Square Root of 0.9729%, which is
9.864%
Question
4) (15 points) My
friend, David, is an excellent student.
The odds of him getting an A in any class he takes are 95%. There is a 5% chance of him getting a B. There are no other grades he can get. He is in the MBA program at Stern. There are 20 classes that he'll take to
graduate.
Question
4a) (5 points) What are the odds that David will graduate with a 4.00
average? Assume that the grade he gets
in each class is INDEPENDENT.
This
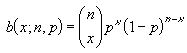
should be modeled using the Binomial Distribution.
You
can approach this one of two ways.
Way
1)
Define
p = the probability that David will get an A = 95%
q
= 1 - p = 5%
Number
of Trials = 20
Number
of successes = 20 (He gets all As)
(20
choose 20) x 0.9520 x 0.050 = 1 x 0.9520 x 1 = 35.85%
Way
2)
Define
p = the probability that David will get a B = 5%
q
= 1 - p = 95%
Number
of Trials = 20
Number
of successes = 0 (He does not get any
Bs)
(20
choose 0) x 0.050 x 0.9520 = 1 x 1 x 0.9520 = 35.85%
The answer is 35.85%.
Question
4b) (5 points) What is the expected number of As that David will get?
The
formula for the binomial distribution is np.
n = 20. p = 95%.
n
x p = 20 x .95 = 19
The answer is 19.
Question
4c) (5 points) My friend Rich is also very smart and is also in the MBA
program. He has a 90% chance of getting
an A in any given class. What are the
odds that Rich will get a better grade than David in any single class? Remember, there are only two grades, A and
Not A (otherwise known as getting a B) and everything is INDEPENDENT.
Hint:
Use a Probability Box to get the answer (you don't have to use a box, if you
don't need to).
Let:
A
= David gets an A
A'
= David gets a B (does not get an A)
B
= Rich gets an A
B'
= Rich gets a B (does not get an A)
P(A)
= 95% (given in problem)
P(A')
= 1 - P(A) = 1 - 95% = 5%
P(B)
= 90% (given in problem)
P(B')
= 1 - P(B) = 1 - 90% = 10%
Since
they are independent we can use the following formula:
The
probability Rich gets an A and David gets a B:
P(A'
∩ B) = P(A') * P(B) = 5% x 90% = 4.5%
Here
is the Box
|
|
B |
B' |
|
|
A |
85.5% |
9.5% |
95% |
|
A' |
4.5% |
0.5% |
5% |
|
|
90% |
10% |
100% |
The answer is 4.5%.
Question
5) (15 points)
You go to
the supermarket to get ingredients for an omelet for breakfast for you and your
friends. You need eggs for your omelet
so you decide to buy a dozen (one box).
This particular supermarket has a reputation for bad eggs. There is a pretty high rate of getting bad
eggs. The probability that a given egg
is bad is 10%. Each egg's badness is
independent of each other egg's badness.
Question
5a) (5 points)
What are
the odds of getting exactly 2 bad eggs in your dozen?
This
should be modeled using the Binomial Distribution.
Probability
is 23.01%.
Question
5b) (5 points)
You realize
you need exactly 11 eggs for your omelet so it doesn't matter to you if one of
the eggs is bad. If two or more eggs are
bad, then you can't make your omelet.
What are
the odds that you can NOT make an omelet?
(meaning what are the odds that 2 or more eggs are bad.).
Here
is a full table:
|
# of Bad Eggs in Total |
Odds |
|
0 |
28.24% |
|
1 |
37.66% |
|
2 |
23.01% |
|
3 |
8.52% |
|
4 |
2.13% |
|
5 |
0.38% |
|
6 |
0.05% |
|
7 |
0.00% |
|
8 |
0.00% |
|
9 |
0.00% |
|
10 |
0.00% |
|
11 |
0.00% |
|
12 |
0.00% |
You
could figure out using the Binomial Formula to find only P(x=0) and P(x=1). Then use this expression:
P(x=0)
+ P(x=1) + p( x>=2) = 100%
28.24%
+ 37.66% + p( x>=2) = 100%
Answer = 34.10%
Question
5c) (5 points)
What is the
Standard Deviation of the distribution for Number of Bad Eggs in your dozen (probability
of Bad egg is 10%).
Answer
User the Formula for Variance and Standard Deviation of a Binomial
Distribution:
Variance = n * p * q
Standard Deviation = Sqrt(Variance) = Sqrt(n * p * q)
1.0392 = Sqrt(12 * 0.1 *
0.9)
Question
6) (5 points)
You have a
certain kind of computer that you use for your factory. Due to various electrical and mechanical
reasons, your computer gets the wrong answer 5% of the time.
A 5% error
rate is too high for your needs, so you decide to set up a system of 5
computers. (Each computer has the same error rate of 5% and acts independently
of other computers.) With your new
system, the decision is based on the majority of the five computers. For example, if 2 computers say
"no" and the other "3" say yes, then you take the answer to
be yes.
What are
the odds that your new system of 5 computers hooked together (with each one
deciding independently from the other) gives you the correct answer?
To help you
out, I am including this excerpt from a Binomial Distribution table.
|
|
50% |
55% |
60% |
65% |
70% |
75% |
80% |
85% |
90% |
95% |
|
0 |
3.13% |
1.85% |
1.02% |
0.53% |
0.24% |
0.10% |
0.03% |
0.01% |
0.00% |
0.00% |
|
1 |
15.63% |
11.28% |
7.68% |
4.88% |
2.84% |
1.46% |
0.64% |
0.22% |
0.05% |
0.00% |
|
2 |
31.25% |
27.57% |
23.04% |
18.11% |
13.23% |
8.79% |
5.12% |
2.44% |
0.81% |
0.11% |
|
3 |
31.25% |
33.69% |
34.56% |
33.64% |
30.87% |
26.37% |
20.48% |
13.82% |
7.29% |
2.14% |
|
4 |
15.63% |
20.59% |
25.92% |
31.24% |
36.02% |
39.55% |
40.96% |
39.15% |
32.81% |
20.36% |
|
5 |
3.13% |
5.03% |
7.78% |
11.60% |
16.81% |
23.73% |
32.77% |
44.37% |
59.05% |
77.38% |
Answer
With
one computer, you have a 95% chance of getting the correct answer (and a 5%
chance of getting a wrong one).
With
5 computers, you have to have the following scenarios to get to the correct
answer:
a)
5 computers pick the correct answer
b)
4 computers pick the correct answer
c)
3 computers pick the correct answer
On
the other hand, if only 2 computers (or less) pick the incorrect answer, then
the whole system will pick the wrong answer.
From the table, the answer is 2.14% + 20.36% + 77.38% = 99.88%
Question
7) (12 points)
Assume X
follows a normal distribution.
The Mean of
X is -40 and the Standard Deviation is 100.
Question
7a) (3 points)
What is the
probability that X > 60?
Z
= 1
P(Z<=1)
= 84.13%
P(Z>1)
= 1- 84.13% = 15.87%
Question
7b) (3 points)
What is the
probability that X <= 180?
Z
= 2.20
P(Z<=2.20)
= 98.61%
Question
7c) (3 points)
What is the
probability that X <= 0?
Z
= 0.40
P(Z<=0.40)
= 65.54%
Question
7d) (3 points)
What is the
probability that X > 0 and less than 180?
or
P(0 < x
< 180)?
=
P(0.4 < Z < 2.2)
P(Z<=0.40)
= 65.54%
P(Z<=2.20)
= 98.61%
P(0.4
< Z < 2.2) = 98.61% - 65.54% = 33.07%
Question
8) (6 points)
Question
8a) (6 points)
You decide
to start selling a new kind of exotic drink, a reverse osmosis, non-ionized,
cold-filtered, smartified, vitalified H-2-wow.
You decide to sell your water drink in a ½ liter bottle. You realize that you'll get fined by the
government if you put any less that 0.5 liters of water in your bottle (false
advertising).
Assume that
your bottling machine (that pours the liquid into the bottles) follows a normal
distribution and has a standard deviation of 0.01 liters.
How much
liquid should you pour into each bottle such that there is only a 0.99% chance
(0.99% = 0.0099) that a particular bottle is less than 0.5 liters?
First: Find the Z score that has 0.99% of the area
to the left of it.
The
answer is -2.33
Then
do a reverse Z transformation, meaning to solve this equation:
Z
= (x - mean) / standard deviation
-2.33
= (0.5 - mean) / 0.01
-2.33
* 0.01 = (0.5 - mean)
-.0233
= 0.5 - mean
-.0233
- 0.5 = -mean
+.0233
+ 0.5 = +mean
The answer = 0.5233 liters