Intro
to Probability and Statistics
Sample
Final #2 – Questions And Answers (Answer Key)
Professor Brian Shydlo
Instructions:
1) Please
write your name: _____________________________________
2) There
are 7 questions totaling 100 points. Please be careful to answer all questions.
Partial credit will be given.
Question 1)
12 Points (Correlation and Covariance)
Question
2) 8 Points (Expected Value and Standard Deviation of a
Portfolio of Two Assets)
Question 3)
15 Points (Sample Means and Confidence Intervals)
Question 4)
15 Points (T Distribution)
Question 5)
29 Points (Linear Regression)
Question 6)
12 Points (Multiple Linear Regression)
Question
7) 9 Points (Miscellaneous)
Total 100
Points
Question
1) (12 points in Total)
You have
the following table of X and Y values.
(For example, there is a 40% chance that X will be 8 and Y will be 11,
and so on…)
|
X |
Y |
Prob(y,x) |
|
2 |
3 |
20% |
|
3 |
5 |
20% |
|
4 |
10 |
20% |
|
8 |
11 |
40% |
To help you
out I have calculated the Variance and Mean (or Expected Value) of each.
μx
= 5
μy
= 8
sx2
= 6.4
sy2
= 11.2
Question
1a) (6 Points)
What is
Covariance(X,Y)?
Answer: ___________________________
Answer 1a)
Covariance = 7.4
|
X |
Y |
Prob(y,x) |
X- μx |
Y - μy |
Prob(y,x) * (X- μx)
* (Y - μy) |
|
2 |
3 |
20% |
-3 |
-5 |
3 |
|
3 |
5 |
20% |
-2 |
-3 |
1.2 |
|
4 |
10 |
20% |
-1 |
2 |
-0.4 |
|
8 |
11 |
40% |
3 |
3 |
3.6 |
|
|
|
|
|
|
|
|
|
|
|
|
|
Sum = 7.4 |
Question
1b) (4 Points)
What is the
Correlation Coefficient of X,Y?
Answer: ___________________________
Answer 1b)
Correlation(X,Y)
= Covariance(X,Y) / (sx * sy)
The
Variances were given, so you need to figure out the Standard Deviations:
sx = √sx2 = √6.4 = 2.530
sy = √sy2 = √11.2 = 3.347
so
Correlation(X,Y) = 7.4 / (2.530 * 3.347)
= 0.874
Question
1c) (2 Points)
Suppose you
got to part B an answer of a Correlation Coefficient of 1.2. What would you conclude about your answer?
Answer: _________________________________________________
Answer 1b)
You
would conclude you made a mathematical error.
Correlation Coefficients must be between -1 and 1.
Question
2) (8 Points in Total)
A certain
stock, X, has an expected return of 40% per year and a standard deviation of
50%.
A certain
bond, Y, has an expected return of 10% per year and a standard deviation of 10%.
The have a
Correlation Coefficient of 0.6
You could
write this as:
mx
= 40%, my
= 10%, sx
= 50%, sy
= 10%, and рx,y
= 0.6
Question
2a) (3 Points)
You decide
to invest $40 dollars in X and $60 in Y ($100 in total).
How much
money do you expect to have in one year?
Answer: ___________________________
Answer 2)
$40 * (1 + 0.40) + $60 * (1 + 0.10) = 122
Question
2b) (5 Points)
You decide
to invest $40 dollars in X and $60 in Y ($100 in total).
What is the
Standard Deviation your portfolio?
Answer: ___________________________
Answer 2b)
Variance(whole portfolio) = (Psx)2 + ((1-P)sy)2 + 2 * (Psx) * ((1-P)sy)) * rxy
Variance(whole portfolio) = (0.4 * 0.40)2 + (0.6 * 0.10)2 + 2 * (0.4 * 0.50) * (0.6 * 0.10)) * 0.6
Variance(whole portfolio) = (0.16)2 +
(0.06)2 + 2 * (0.2) * (0.06)
* 0.6
Variance(whole portfolio) = 0.0256 + 0.0036 +
0.024
Variance(whole portfolio) = 0.0532%2
Standard Deviation of Whole Portfolio = sqrt(154)
= 0.231 or 23.1%
Question
3) (15 Points in Total)
A random
sampling of 100 American shrubs revealed the average height of a shrubbery to
be 60 centimeters. The Standard
Deviation of shrubberies is well known to be 15 centimeters (meaning that the
Standard Deviation of the population of shrubberies is known with certainty to
be 15 centimeters).
Question
3a) (5 Points)
What is the
Standard Error (also called the Standard Deviation) of the Sample Mean?
Answer: ___________________________
Answer 2a)
s x = 15
s x-bar = 15 / Sqrt(100) = 15 / 10 = 1.5
s x-bar = 1.5
Question
3b) (5 Points)
What is a
95% (2 standard deviation) Confidence Interval for the height of an American
shrub? Please assume that the
appropriate Z-score to use is 1.96.
Answer: ___________________________
Answer 3b)
P[60
- (1.96*1.5)
< μ < 60 + (1.96*1.5) ]
= 95%
P[60
- 2.94<
μ < 60
+ 2.94] = 95%
P[57.06 < μ < 62.94] = 95%
Question
3c) (5 Points)
What would
the sample size need to be to get a 95% Confidence Interval that is exactly 9.8
centimeters wide? (Please use a Z-score of exactly 1.96)
Answer 3c)
n
= (1.962 x 152) / 4.92 = 36 shrubs
Question
4) (15 points in Total)
I took a
sample and created 2 Confidence Intervals each with the same Standard Deviation
and Point Estimate of the mean of a distribution. Both Confidence Intervals were for 95%.
The only
thing that was different between the two Confidence Intervals was that for one
of them I used the Z-distribution (Standard Normal) and for the other one I
used the T-distribution:
Confidence
Interval A: P[68.24 ≤ μ
≤ 91.76] = 95%
Confidence
Interval B: P[60.91 ≤ μ
≤ 99.10] = 95%
Question
4a) (4 Points)
For which
Confidence Interval did I use the T distribution (A or B)?
Answer: __________________
Answer 4a)
Confidence
Interval B is wider, so it must use the T distribution.
Question
4b) (4 Points)
For the
distribution that used the Z distribution I used a Z score of exactly 1.96
(meaning Zα/2 is 1.96). What was the Standard Deviation I
used?
Answer: __________________
Answer 4b)
This
is the Confidence Interval as written:
P[68.24
≤ μ ≤
91.76] = 95%
Here
is the formula:
P[μ
- (Zα/2 * s) ≤ μ
≤ μ + (Zα/2 *
s)] = 95%
Which
becomes:
P[μ
- (1.96 * s) ≤ μ
≤ μ + (1.96 *
s)] = 95%
91.76 - 68.24 = 23.52
so
μ
+ (1.96 * s) - [μ - (1.96 * s)] = 23.52
μ
+ (1.96 * s) - μ + (1.96 * s) = 23.52
(1.96
* s) + (1.96 * s) = 23.52
2
* (1.96 * s) = 23.52
3.92s = 23.52 so s = 6
FYI….
The Sample Mean I used was 80, which is at the midpoint of the Confidence
Interval.
(If
you mistakenly put Confidence Interval A for the answer to question 3a, you
would have got that wrong, but this one correct if you put 9.74 as the answer).
Question
4c) (4 Points)
I didn’t
say how many degrees of freedom I used for calculating the T distribution, but
given the following choices, which one do you think I used?
Choice A: 3 Degrees of Freedom
Choice B: 103 Degrees of Freedom
Answer: __________________
Answer 4c)
The
answer is Choice A.
For
Degrees of Freedom of 3, the T-score is 3.18, which is what I used for the
Confidence Interval as written:
For
Degrees of Freedom of 103, the T-score is 1.98, which is very close to the 1.96
that I would have got had I used the Standard Normal Distribution
(Z-score).
This
question was designed to test whether you knew that the T-score becomes equal
to the Z-score as N gets large. If the
Degrees of Freedom where 103, then the 2 Confidence Intervals would have been
almost identical.
Question
4d) (3 Points)
If I had
used the Degrees of Freedom of 103, then what must n have been (or how many items were in the sample or what
was the sample size)?
Answer: __________________
Answer 4d)
The
answer is 104 in the sample.
The
formula for Degrees of Freedom for the T distribution is:
df
= n -1
df
+ 1 = n
so
103
+ 1 = 104
Question
5) (29 Points in Total)
I did a
regression on the following data:
|
# |
X |
Y |
|
1 |
2.060 |
2.044 |
|
2 |
0.064 |
0.059 |
|
3 |
1.202 |
1.124 |
|
4 |
0.800 |
0.500 |
|
5 |
4.099 |
5.080 |
|
6 |
3.516 |
3.500 |
|
7 |
2.157 |
2.362 |
|
8 |
1.378 |
1.410 |
|
9 |
3.481 |
4.084 |
|
10 |
0.301 |
0.319 |
and got the
following information:
The regression equation is
Y = - 0.227 + 1.19 X
Predictor Coef StDev T P
Constant -0.2268 0.1494 -1.52
0.167
X 1.19374 0.06413 18.62
0.000
S = 0.272 R-Sq = XXxXXX
Analysis of Variance
Source DF SS MS F P
Regression 1
25.558 25.558 XXXxXX
0.000
Residual Error XX
0.590 0.074
Total XX 26.148
Unfortunately,
the printer is an old model and it smudged the output. I would print another copy, but I realized
that it was the last piece of paper. Please help me reassemble the original output
Question
5a) (3 Points)
What is the
Degrees of Freedom Total?
Answer: __________________
Answer 5a)
The
Degrees of Freedom Total = n - 1 = 10 - 1 = 9
Question
5b) (3 Points)
What is the
R-Squared?
Answer: __________________
Answer 5b)
R-Squared
= SSR/SST = 25.558/26.148
= 97.7%
Question
5c) (3 Points)
What is the
F-score?
Answer: __________________
Answer 5c)
F-Score
= MSR/MSE = 25.558/0.074 = 345.38
Question
5d) (4 Points)
Please predict
Y using the Regression Equation when X = 3.
Answer: __________________
Answer 5d)
Y
= - 0.227 + 1.19 X
Y
= - 0.227 + 1.19 * 3
Y
= - 0.227 + 3.57 = 3.343
Question
5e) (4 Points)
Please give
me a 95% Confidence Interval for Y when X = 3.
Please use a Z-score of 1.96 for your Confidence Interval.
Answer: __________________
Answer 5e)
The
Point Estimate of Y was calculated in part A to be 3.343.
The
Standard Error of the regression is: 0.272.
P
[3.343 - (Zα/2 * s) < μ < 3.343 + (Zα/2
* s)] = 95%
P
[3.343 - (1.96 * 0.272) < μ < 3.343 + (1.96 * 0.272)] = 95%
P
[3.343 - (0.533) < μ < 3.343 + (0.533)] = 95%
P [2.810 < μ < 3.876)] = 95%
Question
5f) (4 Points)
How might
you respond to someone who asked you to predict a Y with an X of 30?
Answer:
___________________________________________
Answer 5f)
This
would not be valid as you would be extrapolating.
Question
5g) (3 Points)
You do
another, unrelated regression and get the following information:
R-Squared =
81%
The
regression equation is
Y = 10.1 -
0.879 X
What is the
value of R (the correlation coefficient?)
Answer: __________________
Answer 5g)
ρ
= √(R2) = √0.81 = .90
You
need to set the sign to negative since the slope of the Regression Equation is
negative, so the answer is -0.90
Question
5h) (5 Points)
I did
another, unrelated regression and got the chart below. Is there anything about this chart, which
shows the errors (also called the residuals), which would make you question the
validity of this Regression?
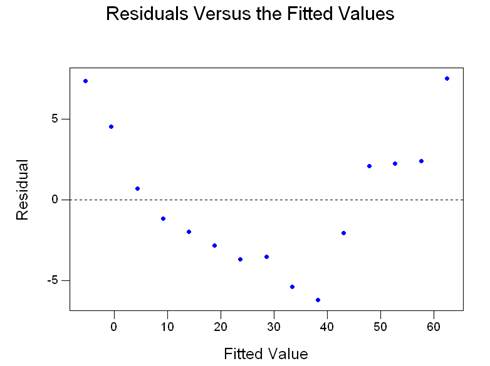
Answer:
___________________________________________
Answer 5h)
The
errors seem to follow a pattern. An
assumption of the model is that the errors are random, hence this picture
suggests a violation of one of the assumptions of the Linear Regression Model.
Question
6) (12 points in Total)
The
following is output from a Multiple Linear Regression:
The regression equation is
Y = - 13.4 + 4.78 X + 0.674
Z
Predictor Coef StDev T P
Constant -13.376 3.867 -3.46
0.005
X 4.7839 0.2727 17.54
0.000
Z 0.6738 0.6479 XXXX
0.319
S = 4.451 R-Sq = 96.5%
Analysis of Variance
Source DF SS MS F P
Regression 2
6598.0 3299.0 166.54
0.000
Residual Error 12
237.7 19.8
Total 14 6835.7
Question
6a) (4 Points)
Please
predict Y when X = 5 and Z = 6
Answer: __________________
Answer 6a)
Use
the Multiple Regression Equation:
Y
= - 13.4 + 4.78 * 5 + 0.674 * 6
Y
= - 13.4 + 23.9 + 4.044 = 14.544
Question
6b) (5 Points)
Please
comment on the value of adding the Z variable to the Regression Model (versus
leaving it out).
Answer:
________________________________________
Answer 6b)
Since
the p-value Z is so high (it is 0.319, which is above 0.05) this suggests that
the Regression should be run again without including Z. I did and got an R-Squared of 96.2%, which is
very close to the R-squared I got using 2 variables.
Question
6c) (3 Points)
What is the
T-score of the variable "Z".
(In the regression output, it is the value with the XXXX in it.)
Answer: __________________
Answer 6c)
The
T-score = (Coefficient - 0) / Standard Deviation =
(
0.6738 - 0 ) / 0.6479 = 1.04
Question
7) (9 points in Total)
Question
7a) (3 Points)
It is
possible to have Covariance(X,Y) = 200 and Correlation Coefficient(X,Y) = -0.6
Please
indicate if this is True or False
Answer: __________________
Answer 7a)
False. The sign of the Covariance and the
Correlation Coefficient must be the same.
Question
7b) (3 Points)
You do 2
simple Linear Regressions:
Y = 0 + 3X
Y = 0 + 5Z
If you do a
Multiple Linear Regression you would expect to see this as your Regression
Equation: Y = 0 + 3X + 5Z
Please
indicate if this is True or False
Answer: __________________
Answer 7b)
False. In general, the slopes of a Multiple Linear
Regression of X,Y,Z would be expected to be different compared to a simple
Linear Regression of X,Y and Z,Y.
Question
7c) (3 Points)
You run a Multiple
Linear Regression of three variables (e.g., A, B, C) and then add a forth
variable (e.g., D) it is possible for your new R-Squared to be higher, even if
there is actually no "true" relationship between D and any other
variables.
Please
indicate if this is True or False
Answer: __________________
Answer 7c)
True. You would expect for the R-squared to
increase since random chance would tend to show at least a small correlation
between two (or more) variables even if the long run value of the correlation
where zero.